
BI Tools Implementation
Company
Akseleran
Project Type
Tools Implementation
Duration
6 Months
Related Teams
Data Team
Engineering
Role
CMO – Project Owner
For any business to stay competitive, especially in times of rising inflation, continuous growth is essential. Growth opportunities can emerge from various areas, but identifying them requires reliable data. The biggest challenge? Ensuring decision-makers have access to accurate, actionable insights when they need them.
At Akseleran, a fast-growing startup, sustainable growth was a top priority. To achieve this, we needed real-time performance monitoring and the ability to pinpoint growth drivers, which meant implementing effective BI tools. Different departments relied on fragmented data, so establishing a single source of truth through a unified dashboard became critical.
What are the BI Tools that we need to use?
Solution
At first we were torn apart between Tableau and Power BI, a couple well-known BI Tools in the market. After several discussions with the Data Team, it was agreed that we would use Tableau for building the dashboard as we did not rely heavily on Microsoft Stack for our IT Infrastructure (which is preferable for PowerBI).
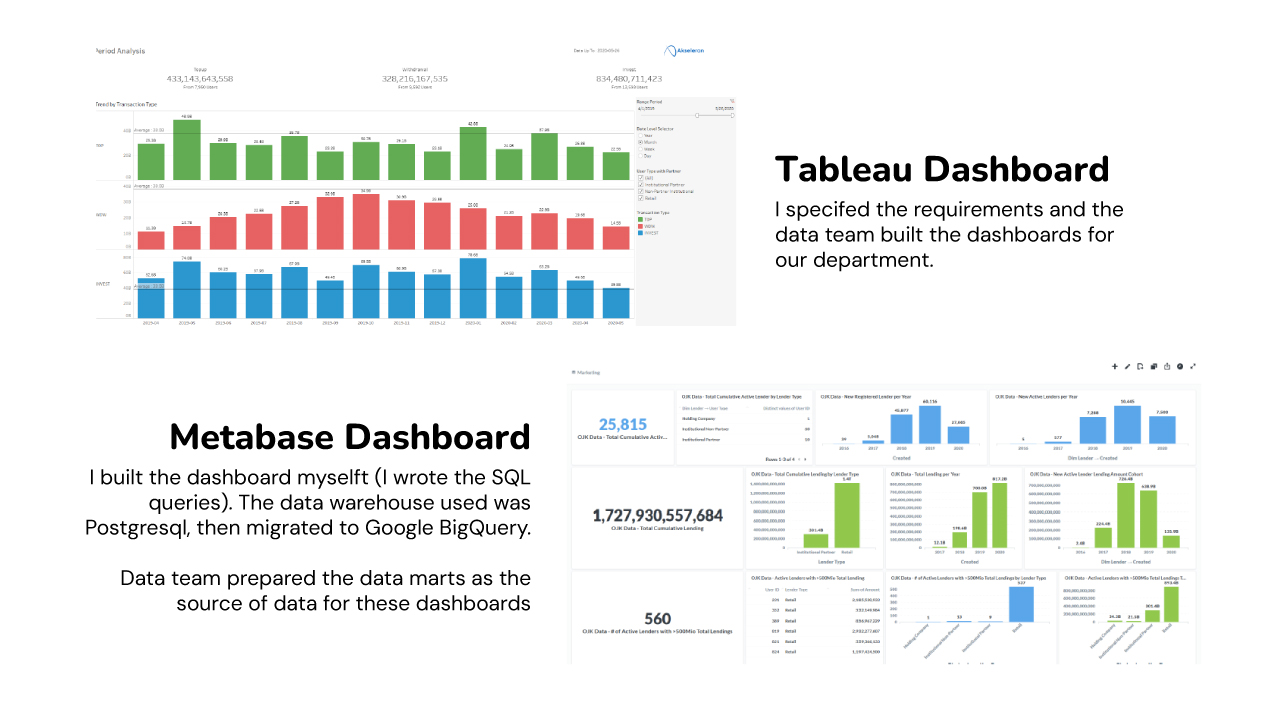
My department (marketing department) was the first department that built the dashboard, as I felt the urgency to have accurate, complete, and quickly available data as a basis for building marketing initiatives.
I gave the business requirements (the data, charts, information needed to be provided in the dashboard) to the data team so they can try to build the data marts and the dashboards. We had several iterations to refine the dashboards until it was ready to be used by the marketing department.
Another BI tool that I used were Metabase and Google Data Studio. Metabase tool used the same data marts that were being used in Tableau so it won’t have redundancy. If Tableau dashboards were built by the data team based on my requirements, Metabase dashboards were built by myself using SQL (Google Bigquery). This way I can have more flexibility for creating new dashboards or modifying existing dashboards when i deemed necessary.
For Google Data Studio, I used it to integrate paid ads performance from Google Ads and Meta Ads with the internal marketing cost. I used Supermetrics to connect the data from Google Ads and Meta Ads dashboard so I can get the whole marketing cost at one dashboard.
Benefit / Result
These BI tools and dashboards became the backbone of our daily, weekly, and monthly reporting, significantly reducing the time required to:
• Analyze performance trends (from days to hours), and
• Make data-driven decisions (accelerating response times).
By automating insights and centralizing data, teams could focus on strategy rather than manual analysis, leading to faster, more informed business moves.
Some of the business results improved by the BI Tools:
✓ Improved acquisition rate as we can monitor, analyze, and improve the area of user drop-off along the registration funnel.
✓ Improved Lifetime Value (LTV) as we can identify the most suitable users to be given retention initiatives, so they can use our platform longer (reduce churn) and increase their monthly transaction value.
✓ Report production time reduced significantly
✓ Reduction in IT team dependency in generating the reports (reduce the manpower costs)